Como puedo hacer graficos estadisticos desde mi app. Si existe alguna manera me sería de gran ayuda.
How can I make statistical graphs from my app. If there is any way I would be of great help.
How can I make statistical graphs from my app. If there is any way I would be of great help.
--
1) you can use a Canvas to make your graph using the x,y positions on the Canvas.
2) you can import your data to a Fusion Table and graph using the tools on the fusion table.
3) I think there is another web based graphing tool you can link too.. unfortunately I do not remember what it is called; perhaps someone else will comment.
What have you tried? If you can show a picture of the type of information you want to graph, users could be more specific with recommendations.
--
Ok, I want do the following, for example I have the following data:
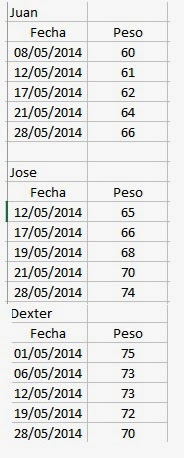
I'm trying graphing into "Fusion Tables" for each, ¿how I can do?.
--
Have you done the Pizza tutorial? It shows how to get data into a Fusion table from an Android device. Look here: Pizza Party with Fusion Tables for App Inventor 2
Here are the basics for getting a graph with Fusion table: https://developers.google.com/chart/interactive/docs/fusiontables ...this information does apply to AI2 also. You use SQL statements to set the graph up or, I believe you can post
the data using your Android and then manipulate the data using either your PC or using your AI2 using a WebViewer component.
Is this easy? No, it is not.
Do the tutorial, try some blocks, then ask again. You will get help.
--
Amigo ya he hecho ese tutoria pero no me sirve para mis propositos, pues neceisto crear desde mi App una tabla para cada usuario y usarla para graficar los datos, pero no se como hacerlo.Como podria lograrlo?.
Friend I have done this tutorial but it does not serve me for my purposes, because I need to create from my App a table for each user and use it to graph the data, but I do not know how to do it. How could I achieve it ?.
Friend I have done this tutorial but it does not serve me for my purposes, because I need to create from my App a table for each user and use it to graph the data, but I do not know how to do it. How could I achieve it ?.
--
the (unfortunately) deprecated Google Chart API https://google-developers.appspot.com/chart/infographics/docs/overview is easy to work with
you will be able to use it until April 20, 2015
for an example how to use it see here http://puravidaapps.com/qr.php#q
alternatively search for another API here http://programmableweb.com/
--
댓글 없음:
댓글 쓰기