Would it be possible to change the background color of the 1st item?
And would it be possible to make the 2nd item's visibility to false?
--
Would it be possible to change the background color of the 1st item?
It is all or nothing. You can not change the colors of individual items but you can change the ItemBackgroundColor for all of the items.
And would it be possible to make the 2nd item's visibility to false?
You cannot do this either. You can provide a second list identical to the original but with the 2nd item removed. Just modify the ElementsFromString or Elements, depending on how you populate the ListPicker.
Thanks! Can that access images on the web, as an asset, or on the device?
--
And can it be scrollable? Thanks so much!
--
Yes it can be scrollable, depends on how you write your html ;)
Check the rest of the post I linked for a php version which is web based, but the javascript one will pull from a webserver too (base the html on the server)
--
I just tried the file attached to your "Good news, I believe I have a solution. Taifuns ListView stuff was very useful, but..." post.
I have absolutely no idea what I'm doing. I've never used HTML and jQuery with App Inventor in my not-very-long app inventor coding life.
How do I:
have all the images resized before being displayed?
have the images in a vertical layout?
write the HTML so it scrolls vertically?
And does that version work without Internet connection?
Thank you so much! Awesome job coding it!
--
How do I:
have all the images resized before being displayed?
Probably best to size all your images before use, this is best practice, but if not you will see some css that does this in the html file
<style>
img {
width:100px;
    height:100px;

}

</style>
have the images in a vertical layout?
Easiest way is to put a <div> with some css styling around the script, or reduce the width of the webviewer so only one image fits
Thanks so much! I should've remembered how to do the first one. I'll reduce the width of the webviewer, which will work perfectly with my app. Thanks! Does it need Internet connection to run it? Once the app is packaged, I mean, since you have to have Internet to use the companion.
We know you all work hard on your apps, and everyone loves to show off their stuff.
Use this category to post LINKS to your apps. You may post screen shots or AIA (project source) files, but do NOT post APK files here... Those will be deleted by the moderators. Better than uploading, link to websites that describe your apps, so all of us can take a look and see what you've accomplished.
ONLY POST LINKS TO APPS YOU CREATED WITH APP INVENTOR HERE! OTHERS WILL BE DELETED!
We will verify the AI Authenticity of each link posted.
When you post here, PLEASE use a one or two word description in the subject first, so we know what type of App you've done. That will help other people searching for examples. For example, a good subject line would be GAME - Check out my penguins and igloos game! or PHOTO GALLERY - Store your pictures in an organized way!You get the drift ;) MIT assumes NO responsibility whatsover for the program links posted, and advises ALL participants to exercise extreme caution before installing any app that's not already registered and accepted by the Google Play Store or other major vendors.
ANY INSTALLATION OF ANY APPLICATION, BE IT AN APP INVENTOR APP OR AN APP CREATED BY ANY OTHER SYSTEM IS SERIOUS BUSINESS. ANYTHING YOU ACCESS FROM HERE IS DONE COMPLETELY AT YOUR OWN RISK.
Is there a way to change the background color of a screen title bar, I mean, not the title text, but the actual grey color in the title bar part of a screen.
--
Don't believe this is possible, but you can emulate it by making the real one invisible and replacing it with a label, which you can then format background, text, etc.
If you are lucky, someone might be aware of a different solution so check back here frequently to see other posts.
App Inventor is an entry level Android compiler intended primarily for teaching programming. It does not have the extensive libraries and tools that would allow you to do something like this with the Java based Eclipse or Android Studio.
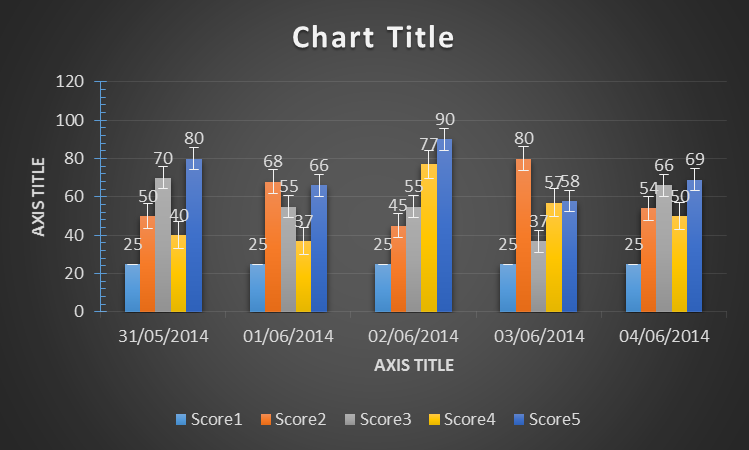
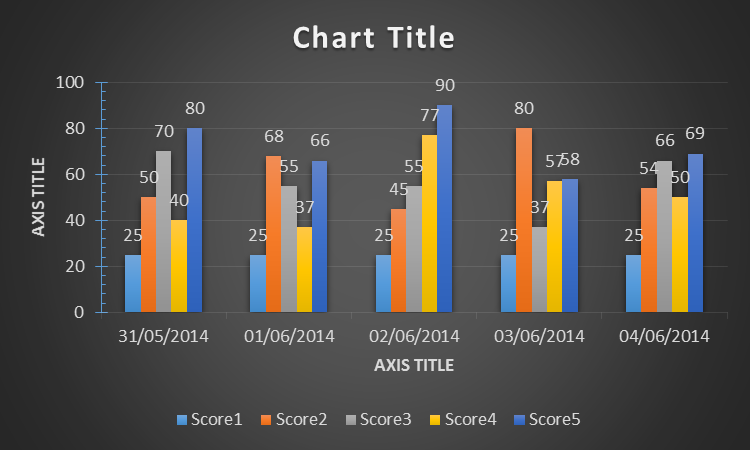
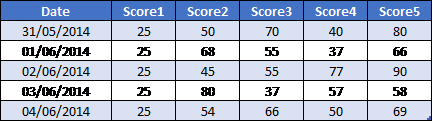
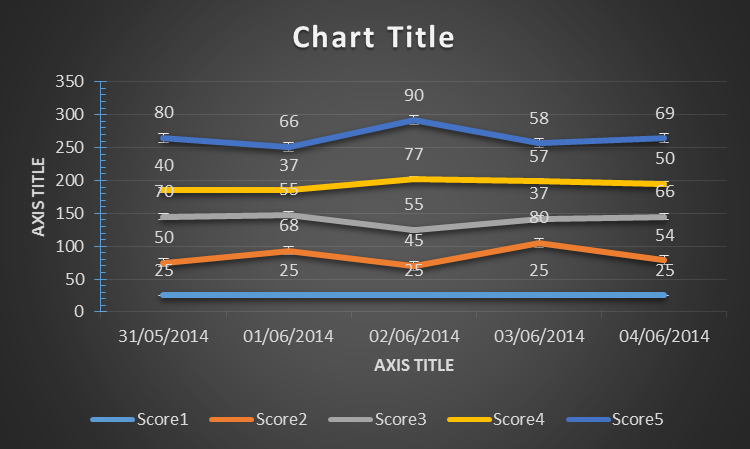
Please advice how to plot a Chart (Line, Bar, with option to add Candle Stick - Error Bar) for data saved in the file (saved using File Component of App Inventor). I need to plot a chart for Five Variables for given date Range. Following is the sample data.
File Data: (2 Jun 2014 13:11:06 46 53 100 35 75)
Please see attached Pictures for Sample Data and Charts (created in MS Excel)
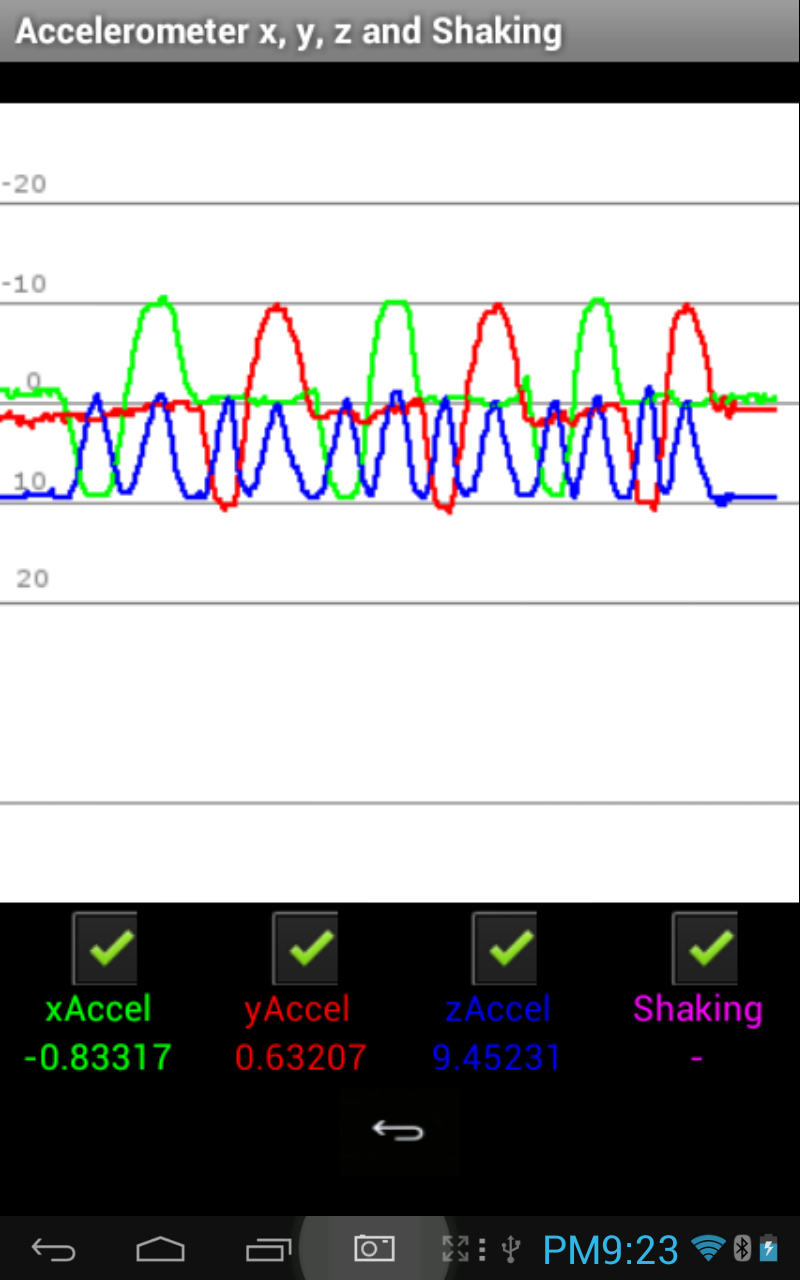
I had suspected my X sensor was noisy. This confirms it.
The Shaking label never turns off once it has been triggered?
--
The Shaking label never turns off once it has been triggered?
I have fixed that in the current aia attachment.
A timer clears the value after two seconds.
--
I had suspected my X sensor was noisy
Hi Abraham!
I suppose you already know this, but you can take several samples from a sensor property then average them to smooth out a sensor result.
I did not do that in this example.
I did average OrientationSensor Azimuth values in my basic digital compass project to keep the dial that indicates current heading from swinging too wildly.
--
Thanks for the tip.
I had some idle speculation of using the waveform of the Orientation Sensor to detect small table vibration patterns during battery bounce tests. (There's a YouTube video going around ostensibly showing how weak AA batteries rattle when they bounce off their negative ends while fresh batteries bounce with a thud. (search for 'battery bounce test snopes' for discussion.)
My device's sampling rate and sensitivity are insufficient for such tests.
This is all just for fun.
--
Interesting. I had not realized the accelerometer could indicate levels of vibration.
--
Have you developed a method for the graphs to slide to the left as time passes. Ie new data comes in from the right and slides across the screen, disappearing out the left side?
--
You might have to use multiple images connected
to your canvas like tank treads, using the Save Canvas
block to prime the images with saved canvas files
when the current canvas fills.
Shrink the leftmost image width as the canvas on the right fills.
When the canvas fills, save its image and propagate the list
of image files down your list of image components, using the
ANY Image blocks, then clear the canvas and resume drawing.
--
When the Canvas is filled from left to right with the initial graph, a snapshot of the canvas might be taken then inserted in an ImageSprite which could then be scrolled to the left one pixel per Clock Interval.
Now you have to plot new points trailing behind that ImageSprite and redraw them each time the ImageSprite moves a pixel to the left, then capture the screen again when they have reached the left edge of the Canvas.
That would require too much processing, I think.
--
I wonder if it would be possible to save the results during a measurement for subsequent analysis results, in the Excel or some other program. And if it is possible, who can i do it?
--
You might ask that question on the MIT App Inventor forum.
Hey, I'm still kind of new to this App Inventor and app designing at all really but I was hoping someone or a group of people could help get me in the right direction of making a graph. It's the end of the year for me and I'm About to graduate, My teacher threw this at me saying my other project wouldn't work so I'm on AI2 now. I have a very basic idea of what to do I think but like I said I am still new all of this. Any help will be appreciated thank you very much.
You can graph using the Canvas. This is what ABG is eluding to in the referenced link. You use the screen canvas coordinates to plot data.
Here are two key routines, one converts map coordinates to World coordinates, the other converts World coordinates to map (Canvas screen) coordinates. and it will give you a graph where values become screen pixels: to get the example x * 2 = y plot. Yes, you need quite a few global variables and the plotting routines.
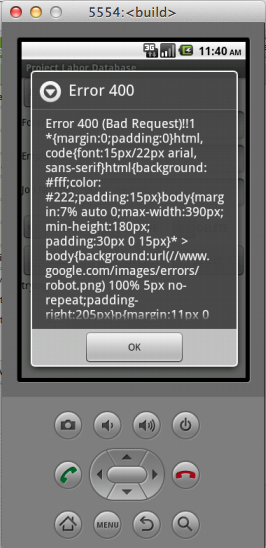
Hello all! I am having an issue when I try to select values in a column from google spreadsheets I am getting a error message "Error: Access denied. Access denied" I have a get and insert setup and working correctly so I am not certain what I may be doing incorrectly and am turning to the community for some direction!
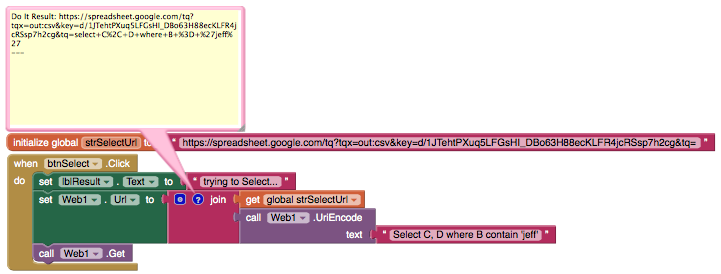
Here is a post of my blocks. Please let me know what else I may need to provide. Thanks in advance.
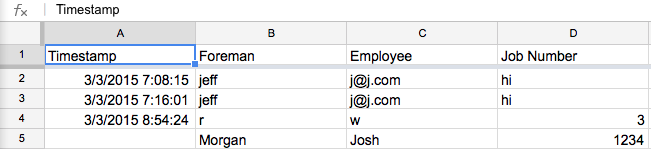
the first column is A, the second is B, the third is C, etc.
Note that column IDs in spreadsheets are always letters; the column heading text shown in the published spreadsheet are labels, not IDs. You must use the ID, not the label, in your query string.)
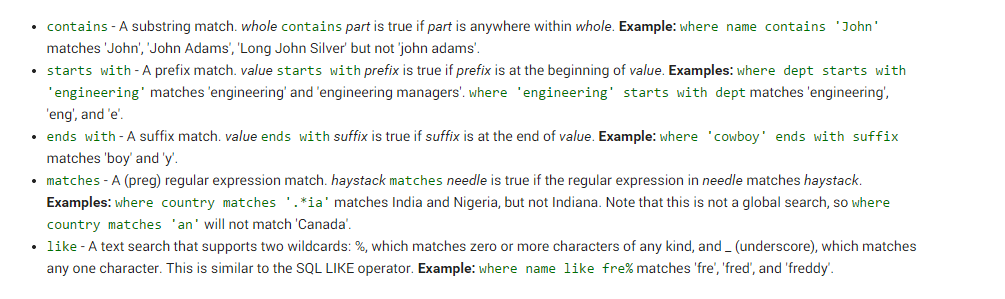
your query should look like this: select C,D where B matches 'Jeff'
--
Hi Taifun. . .thank you for the reply. I did your spreadsheet tutorial and how I am arriving at the blocks I have. Also, I did have that query select C,D where B matches 'Jeff' but was still returned with the error message as above.
I know the form is setup correctly as I can insert and get it is just the select that is denying access. I can post any of the blocks the allow the insert and get if that helps. I have even tried just a select of a single column with not adding a clause
--
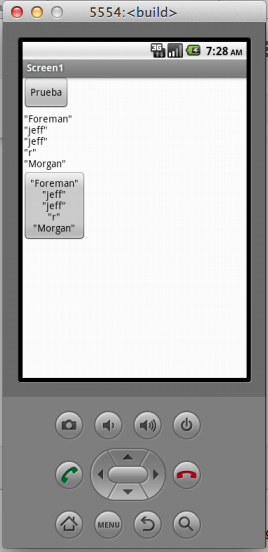
can you provide a screenshot of your spreadsheet? relevant would be the header row and the row we can find Jeff in column Foreman
--
here is the screenshot of the spreadsheet, which shows jeff in column Foreman.
--
try this line
Select C,D where B contain 'jeff'
you cant used the name of column you need used the letter , like example.
--
in other case and most better is
Select C,D where B contain 'jeff' limit 1 if you want only 1 row , if you want more row delete limit 1.
--
Hi Ritchie. . .thank you for the reply. I tried your suggestion and received the same result. I did notice that you have capitalized your Select and instead of = you had me use contain. I am pretty green on SQL but is that a statement that works usually?
--
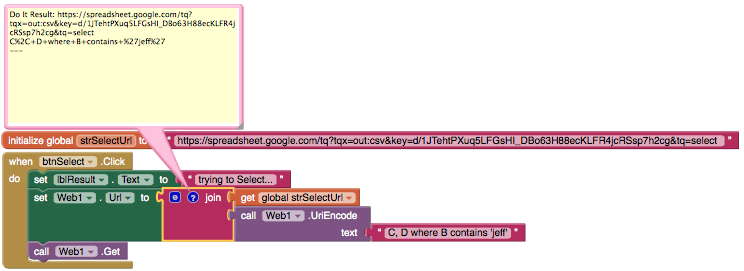
here is a screenshot with the Do It comment.
--
I would use contains instead of contain, also I would use select instead of Select
and if you want to try matches again, this would be the correct statement: select C,D where B matches 'jeff'
but if you still get this error error message "Error: Access denied. Access denied" it seems to be, something in your setup is not correct...
--
Hi Taifun. I did read that google visualization API and why I asked about the capitalization. I also saw that you could put the select statement directly after the Url and here is the statement in the selectUrl block. When I did this I got a 400 error. So if it is something in my setup I am not sure what.
--
your latest screenshot does not make sense, because select is part of the query and the complete query should be uri encoded...
--
Hi Taifun. I am only showing what I have tried. As I agree with you that the select statement should be part of the complete query. I am at a loss because this should be working and if it is something in the setup I really am not sure where.
--
you can try my example project again (there is the aia file to download available in the download section) https://puravidaapps.com/spreadsheet.php and start from scratch, you might want to create a new spreadsheet as test, just follow the setup instructions EXACTLY
Hi Taifun. . . I will start from the beginning again on your tutorial. I would love to support you, but currently I am unemployed and writing this app for a friend for free hoping it will help me get a job!
A futuro en proyectos importantes no es recomendable publicar tu clave API para que nadie manipule tu mesa
Tu API KEY = 1JTehtPXuq5LFGsHI_DBo63H88ecKLFR4jcRSsp7h2cg
Tal vez te sirva un poco de esto que he aprendido gracias a los foros... To future in important projects it is not advisable to publish your key API so that nobody manipulates your table Your KEY API = 1JTehtPXuq5LFGsHI_DBo63H88ecKLFR4jcRSsp7h2cg
Maybe it will serve you some of this that I have learned thanks to the forums ...
Hola Isaias. . .como esta? mi español es muy malo. hablo en english por tus. Hello Isaias. . .How is it going? My Spanish is very bad. I speak in English for you
Thank you for those links, I will read over them as I am certain they will help. I downloaded your aia and of course all worked. I will study what you did and have started integrating into my app. I now need to figure out how to put those columns into a listpicker so the end user can easily select the proper choices.
And on a personal note I will be certain to not publish my API in the future!
I was trying to create a graph on our app that can work quickly and efficiently. However I found that it is very hard to accomplish this with the MIT app inventor 2. Using the the canvas and drawing each graph is to complicated and messy. At this current time, I am thinking about using Google Fusion Table, which can be used in MIT App Inventor. It would be greatly appreciated if you could recommend us to efficiently generate and analyze graph based on inputed data.
Is there a limit on the URL length for the Google Chart API? What is the maximum URL length?
The maximum length of a URL is not determined by the Google Chart API, but rather by web browser and web server considerations. The longest URL that Google accepts in a chart GET request is 2048 characters in length, after URL-encoding (e.g., | becomes %7C). For POST, this limit is 16K.
I have no much knowledge on http or javascript. So I unable to use the Google Chart API(non deprecated version) in app inventor. But I would like to maximize the query record in Google Chart API(deprecated) . If I am not wrong , I guess the method I using is GET method. So the longest URL limited to 2048 characters.
Like this in app inventor : call webviewer1.GoToUrl
So is it possible to use POST method in App Inventor 2? If it is not possible I have to limit the query record size to eliminate the record exceed problem.
--
generally you can use the Post method in App Inventor, but your example is a Get example, which means in your case you can't
your URL currently has 214 characters, you still have some space...
--
This is only the example I show for reference . There is 4 records now . But I expect my app would query 1000 or more records in final. So the limited in URL length would be exceeded in entire method. So I am seeking better method to overcome the limitation.