2017년 3월 4일 토요일

Graficar desde mi App (Graph from my App)


Como puedo hacer graficos estadisticos desde mi app. Si existe alguna manera me sería de gran ayuda.

How can I make statistical graphs from my app. If there is any way I would be of great help.

--
1) you can use a Canvas to make your graph using the x,y positions on the Canvas.
2) you can import your data to a Fusion Table and graph using the tools on the fusion table.
3) I think there is another web based graphing tool you can link too.. unfortunately I do not remember what it is called; perhaps someone else will comment.

What have you tried?  If you can show a picture of the type of information you want to graph, users could be more specific with recommendations.

--
Ok, I want do the following, for example I have the following data:
I'm trying  graphing into "Fusion Tables" for each, ¿how I can  do?.

--
Have you done the Pizza tutorial?    It shows how to get data into a Fusion table from an Android device.   Look here:   Pizza Party with Fusion Tables for App Inventor 2

Here are the basics for getting a graph with Fusion table:  https://developers.google.com/chart/interactive/docs/fusiontables   ...this information does apply to AI2 also.   You use SQL statements to set the graph up   or, I believe you can post 
the data using your Android and then manipulate the data using either your PC or using your AI2 using a WebViewer component.

Is this easy?    No, it is not.

Do the tutorial, try some blocks, then ask again.   You will get help.

--
Amigo ya he hecho ese tutoria pero no me sirve para mis propositos, pues neceisto crear desde mi App una tabla  para cada usuario y usarla para graficar los datos, pero no se como hacerlo.Como podria lograrlo?.

Friend I have done this tutorial but it does not serve me for my purposes, because I need to create from my App a table for each user and use it to graph the data, but I do not know how to do it. How could I achieve it ?.

--
the (unfortunately) deprecated Google Chart API https://google-developers.appspot.com/chart/infographics/docs/overview is easy to work with
you will be able to use it until April 20, 2015
for an example how to use it see here http://puravidaapps.com/qr.php#q

alternatively search for another API here http://programmableweb.com/

--

Unable to show chart correctly


I generate the url as below and set as home url and call webviewer1.goHome. But return a blank chart as attached. But the url shown correctly at my computer chrome browser. Why?

 https://chart.googleapis.com/chart?chtt=Test Graph &cht=bvg&chs=450x200&chd=t:5,6,7&chxt=x,y&chxl=0:|11/42015 | 11/3/2015 | 11/2/2015 &chg=10,20&chm=N*f0*,000000,0,-1,11

 Screenshot_2015-11-05-02-44-58.jpg

--
We cannot see your blocks so we do not really know.     

Here is some advice about how to use the Chart API ....   
                                 it might help you.

Instead of using a WebViewer, why not import the chart directly to an Image or Canvas object as described in the tutorial.

Again, without seeing what is in your blocks, we do not know.  Perhaps instead of assigning the http to home, set it directly in the WebViewer URL block?  I suspect that the pipe (   |    in the code is the problem...perhaps replace that with  %7C   ... I think that is correct.  Try it   or use the WEB URI encode block.

Did either of those work?

--
you should URIencode the different parameters, especially those containing spaces
you can find that block in the web component
alternatively remove the spaces manually

--
Thanks Steve and Taifun.

I tried the urlEncode, but error occur . I am not familiar with canvas. I read the canvas graph tutorial and downloaded the CanvasGraph.aia. I perfer using CanvasGraph method rather than Google Chart API. Because it can use at offline. I use webviewer because it able to scroll for viewing. So X-axis would not be limited by the screen size that represent more record can be shown.  The CanvasGraph.aia is too complicated for me. I unable to extract the line graph or histogram method from it. The deprecated Google Chart API is not an ideal method to plot graph as it has 2K length of text limitation. So it unable to carry 1000 records for my application. But I just try to use or I have to limit the record size for the text limitation. If somebody can extract the CanvasGraph as different graph model in separate aia. I think it would be much easier for people to learn and use. 


--
Do this: (as Taifun suggested)
segement = " ", replacement=""
And optimize your blocks! For example, it is not necessary to set the 4 local variables in Generate_Url_For_Graph at the start of the procedure to the same value as you just initialized them.

-- 
Thanks Chica. Problem solved.

--


QR code generator


HI everyone, I need to generate a QR code in my app, the information that contain the QR came from a textbox, some can help me?

--
one method is to use the Google Chart API, see here http://puravidaapps.com/qr.php#q

--

Displaying of Math Formulas in the app


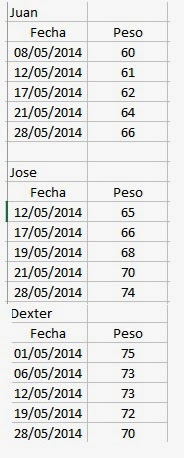
Hi i am developing one multiple choice questions practice app ,
in that i am taking questions from fusion table column ,
but i am not able to display maths equations formula questions like example    \frac{{ - b \pm \sqrt {{b^2} - 4ac} }}{{2a}}        these formulas i am not able to display in the APP and not able to insert in the fusion table column also , could you suggest solution for this issue.

--
I think you are going to have to use images for that.

--
Not knowing exactly what is happening ... you might be able to display them by placing them in quotes "       "   and copying and pasting them into a Text  box and transferring them were needed.

Does placing the required text in quotes help.   Part of the issue might be that some of the symbols might not exist in the current Android font on a device.   In that case you might use the ascii symbols instead of the actual 'characters'.

\frac{{ - b \pm \sqrt {{b^2} - 4ac} }}{{2a}}


--
Actual my intention is to show formula like this  above in the Mathematics questions in the app  , how to do that 

--
To display that you will have to use an image as part of the question.    x = ( -b +- sqrt (b^2 - 4 * a * c ) / 2*a     is the best that is possible using a normal font.

--
Normally  i am saving questions in the fusion table column for the other subjects but in the maths i have to show equations , how to store and get  it these images from the web or from the fusion table  , why because i wanted to control and update these questions from my end , instead of putting these images or questions in the App

--
You can have all the equation images loaded in your assets and store in the fusion table the reference to it.

--
Normally
1) i am getting questions from the fusion table column for the other subjects but in the maths i have to show equations from fusion table column
2) how to store and get  it these images  from the fusion table column , why because i wanted to control and update these questions from my end from fusion table column ,
3) Don't want save images in assets folder  in app  , Because these images (Questions) are dynamic i have to get it from fusion table column only

--
1) Perhaps lower your expectations and use equations like   x = ( -b +- sqrt (b^2 - 4 * a * c ) / 2*a    easily, though they are not as pretty as the images.
2) Store links to images on the FT and the actulal images are stored on your Google Drive perhaps.... there a plenty of discussions in the Forum about doing that.. and then deal with a lot of code blocks and complexity.

--
I wonder if that formula markup would work in a WebViewer?

--
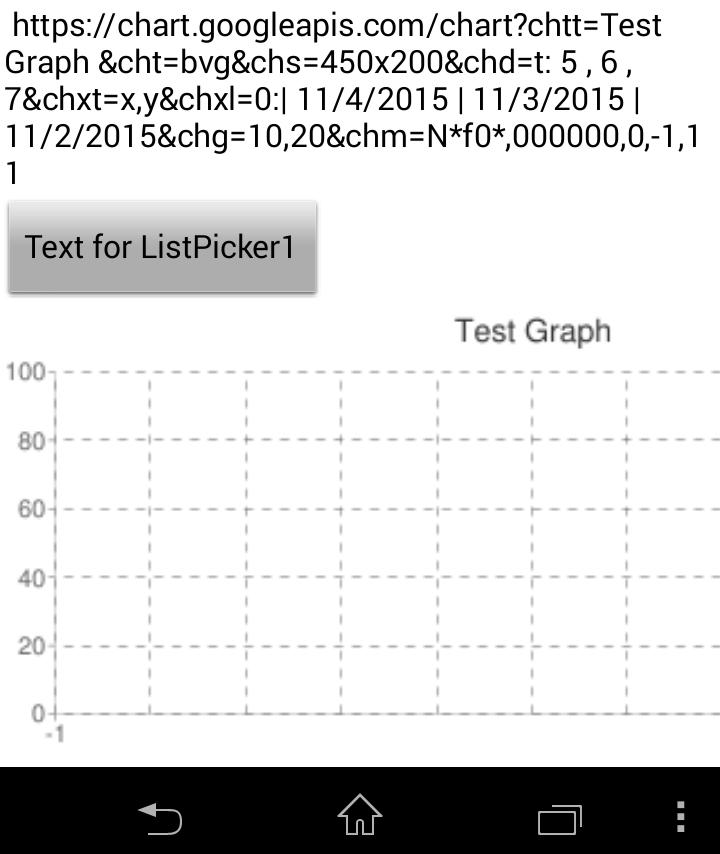
Isn't it what you are looking for?
It's an api, you send the url with the equation encoded in it, and receive the image. 

Example:

https://chart.googleapis.com/chart?cht=tx&chl=x=\frac{-b\pm\sqrt{b^2-4ac}}{2a}

generates this image:

--
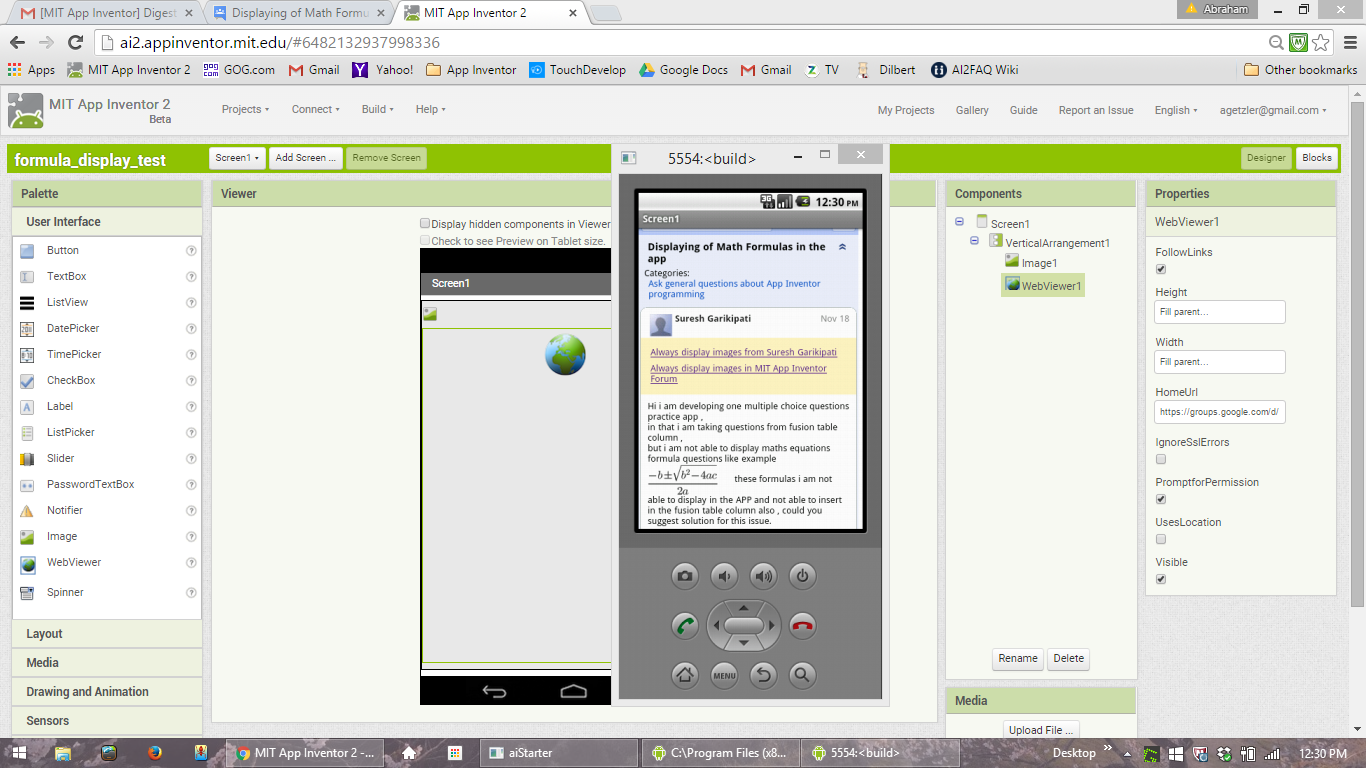
In reply to my earlier guess,
see the attached screen shot of
your first post, with formula,
displayed in a WebViewer fed from
the link of that post.

So if you can set up your questions on the Web somewhere,
you can save their URLs in your Fusion Table and
display them in a Web Viewer.


--
I don't think a web viewer is needed, I did this and it works:

--
Cool its working , Great solution , Thank you Italo ,
can we save these images temporerly in tiny db , is it possible?

--
TinyDB will save anything that is text or numbers. Image files are not saved in it, so you can save the URL on it.

--
Thank you italo , wonderful solution from you ,Thanks a lot.

--
Italo...I changed the catagory for this post to Tips and tricks... nice idea ABG/Italo.

--
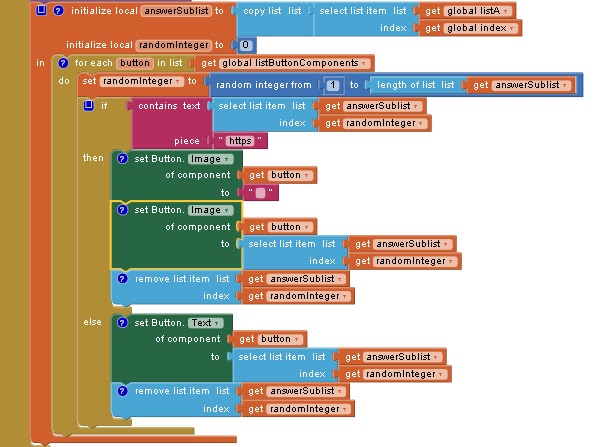
Hi Italo I tried to set button1.image to this image url which is got it from fusion table , first iteration its working its showing image of first row url for the next step next row data url its not uploading , where is the wrong in it, is there any limitation of loading this url as   to set button1.image image

--
It would really help if you provided a screenshot of your relevant blocks, so we can see what you are trying to do, and where the problem may be.
also use Do it to debug your blocks...

--
Global ListA variable is having multiple choice answers list from fusion table , these answers are allocated to different button texts , if normal plain text with out math symbols , if any math symbols choice answers are url's starts with https , then instead of button text its allocated to button.image image , when i am testing first time when image urls answers comes from fusion data table these buttons are showing images every thing fine , for further (next) questions if any image urls data from fusion table button.image image was not loading
--------
for example image data url  is saved in fusion table column is like under

-----
this above image i am allotting to as button.image image

--
I see two possibilities ...

1.  Residue from the prior question is not being cleared.
    You are loading an image but not clearing the prior text and background color, or
     you are loading a text but not assigning an opaque background color and clearing the image.
    This is pretty certain, from your block shot.

2.  Something is happening in your progress through ListA.
      I can only guess, since there are no block shots for that.

--
As per your answer
1. i am already clearing Residue from the prior question button.text as well as button.image properties

but i am not touching back ground color property of button any where

2. what might  happens in progress through ListA  i dont know any guesses will solve the problem i think ,
 why because if data contains plain text its appearing, if data contains url then image property is not loading that to in the second time on wards only

--
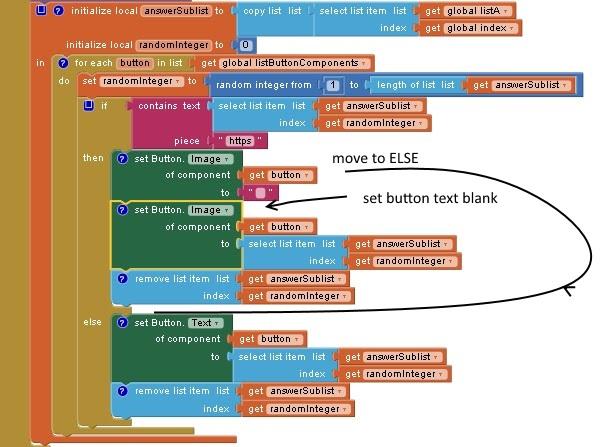
See attached for recommended cleanup changes,
based on your last block shot.

There is not enough provided block shots to help further.

 corrected button image.jpg

-- 
Thank you for your concern . what you said is also right sir i have done this cleaning before this block it self sir,
finally i found the problem lies at image url which i got from fusion table that is 


in the above url there is a gap before and after   x   in the above line that is the actual problem  i found and 
its better to remove  '\left'    and  \right    also

final image url should be like under and its working
https://chart.googleapis.com/chart?cht=tx&chl=f(x)

Anyway Thanks For your Support , thank you somuch

--

Drawing Bar charts using App Inventor 2


How can I use the App Inventor 2 to draw horizontal bar charts corresponding to different values?

--
You have to create them using a canvas and drawing the corresponding lines and objects...

--
Canvas is the 'right' way.  Canvas works for both horizontal and vertical bars.   

However if you want just horizontal bars, consider using a series of buttons in a Vertical Arrangement.  Make the text color none, do not have any text. Make the button 'bar' a nice color.  Change the length of the by set Button.Width =  (a Math block value)     i.e. 24, 55  ...up to the width of your screen (these values are in pixels).  If the horizontal graph bars need to be labeled, make the height greater and use the button's labels and a small font.
--
That's pretty slick Steve!

-- 
another alternative is to use an API, the following example could be adjusted to your needs
Thanks Steve, I tried it and it worked perfectly. Thanks!!!.

--

i want insert a graphic table


i want to insert a estadistic table in my app whit the calification of the day of the user (1-5) and the day of these calification. something like that:
how can i made it?

-- 
Here is a simple way to make a bar graph:  Drawing Bar charts using App Inventor 2   


A more complex way would be to use the Canvas tool, either using Sprites, where you use code to change the horizontal or vertical dimensions of the 'bar' sprites or use images

Another complex way would be to use an API,  Taifun has recommended 

--
see this example https://puravidaapps.com/pie.php, which generates a pie chart, there are several other possibilities, see also  the Chart.js JavaScript library.

-- 
Here is how to do a bar graph simply using a Canvas and sprites

For the example, use seven png sprites, each 10 pixels x 10 pixels.  The Canvas as shown has 200 vertical pixels to work with .  You have to scale your actual input.  The text block could display your graph's scale.  You could also use a Background image in the Canvas to show a scale.  Use your imagination.

--

Is it possible to create a QR code with app inventor?


I am creating an application where I want to pass information to another mobile device from my app inventor project. It is a simple text string. I want my app inventor program to create a QR code on the screen that could them be scanned by the other device. Any ideas or suggestions would be much appreciated.

--
Although a QR code is likely not the most efficient way to pass information from one device to another (Bluetooth or the Near-Field functions are likely better), it is easy to create a QR code.
First create an activity starter.  Set the properties to what's inside the quotation marks:
Action: "android.intent.action.VIEW"
Set the "[YOUR TEXT]" part of the DataURi to whatever you want the generated QR code to say.

Then set something to trigger the activity starter, like a button.

--
yes, the Google Chart API is a nice API, however it is officially deprecated, but it is still working, see also https://google-developers.appspot.com/chart/image/
here is an alternative solution with some JavaScript https://puravidaapps.com/qr.php

--

Google Chart API Implementation *URGENT*


We are currently developing an app in which we implement the Google Chart API to return a picture of a graph based on data points the user inputs. 
For some peculiar reason, when we set an image as the example link below, it only shows on Samsung Galaxy S3 phones. When we attempt to load this API Graph image onto other phones (Moto X and LG Optimus T) it doesn't appear. Anyone have a similar problem?

Example of a Google API Image Link:

Btw, the height and widths were adjustable in the code.
  • Samsung Galaxy S3 Android 4.1.2 (4X - Tested on 4 Galaxy S3s)
  • LG Optimus T Android 4.1.2 (1X)
  • Moto X Android 4.4.2 (2X)
Thank you so much for your time!
It is greatly appreciated

--
This problem is resolved.

--
Please tell us what your solution was... it'll help others learn...

--
are you aware of the following?


The Image Charts portion of Google Chart Tools has been officially deprecated as of April 20, 2012. It will continue to work as per our deprecation policy.

--

I finally made a simple line chart aia


I finally made a line chart aia. It is simple input by the X and Y  data in list. It is auto scale with the data in list and fit to any size of canvas. Just a very little scale tolerance in scale conversion.  Y ratio to control the scale.   Drawing graph in canvas is relative slow in compare with google api chart method. The more data in list the more time to generate the graph. But it break the character limitation of the google chart api (deprecated) . For somebody have no much knowledge on javascript like me. It would be a viable solution. 

I found that if both webviewer and canvas in same screen. The canvas drawing will not work correct at first time drawing. I am not sure is it only happening on my device. Please help to check. I am now set a timer to redraw the canvas after a second to overcome this problem.


--
I switched Screen sizing to responsive and it looks and works better.
Especially when rotating the device.
Try it.


--