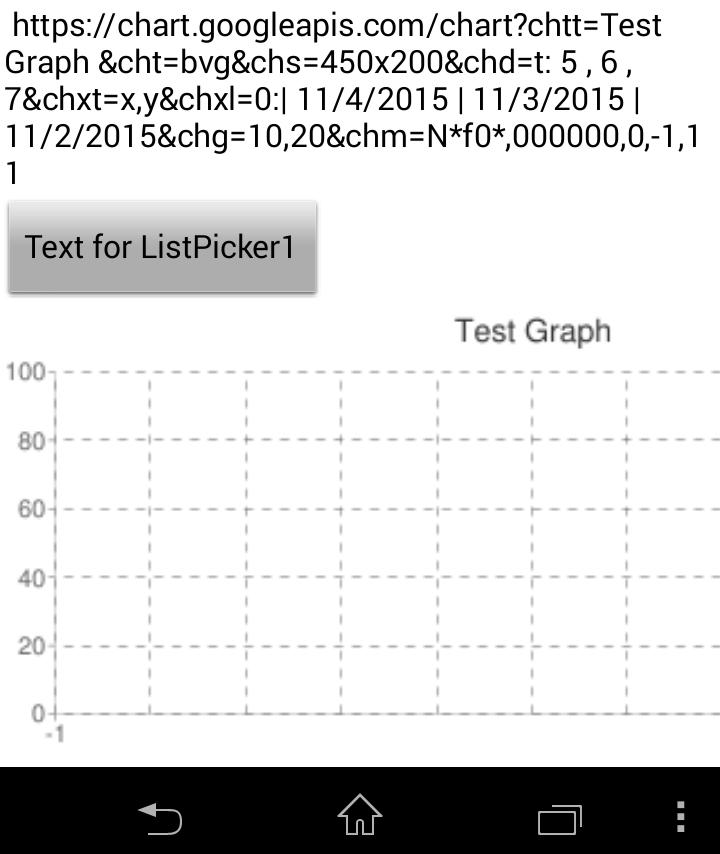
I generate the url as below and set as home url and call webviewer1.goHome. But return a blank chart as attached. But the url shown correctly at my computer chrome browser. Why?
https://chart.googleapis.com/chart?chtt=Test Graph &cht=bvg&chs=450x200&chd=t:5,6,7&chxt=x,y&chxl=0:|11/42015 | 11/3/2015 | 11/2/2015 &chg=10,20&chm=N*f0*,000000,0,-1,11

--
We cannot see your blocks so we do not really know.
Here is some advice about how to use the Chart API ....
it might help you.
Instead of using a WebViewer, why not import the chart directly to an Image or Canvas object as described in the tutorial.
Again, without seeing what is in your blocks, we do not know. Perhaps instead of assigning the http to home, set it directly in the WebViewer URL block? I suspect that the pipe ( | in the code is the problem...perhaps replace that with %7C ... I think that is correct. Try it or use the WEB URI encode block.
Did either of those work?
--
you should URIencode the different parameters, especially those containing spaces
you can find that block in the web component
alternatively remove the spaces manually
--
Thanks Steve and Taifun.

--
Do this: (as Taifun suggested)
segement = " ", replacement=""
And optimize your blocks! For example, it is not necessary to set the 4 local variables in Generate_Url_For_Graph at the start of the procedure to the same value as you just initialized them.
--
Thanks Chica. Problem solved.
--
댓글 없음:
댓글 쓰기