Changes log:
140428 09:30PM CST: fixed the Shaking label so it resets after two seconds; swapped x,y colors to match diagram arrows
---
This project draws a graph of the x, y, and z values for the accelerometer sensor.
It also indicates when the device has been shaken.
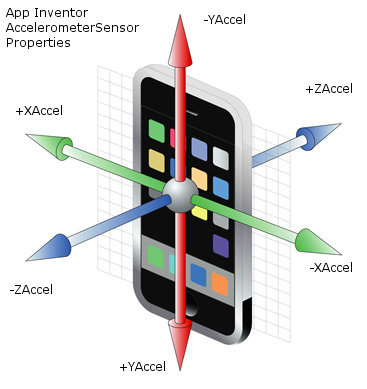
The diagram below shows that if the device is laid face up on a table top, the ZAccel value from gravity will be positive.
Turning the device on it's left side will make the XAccel value positive
Standing the device upright as in the diagram will give YAccel a positive value.
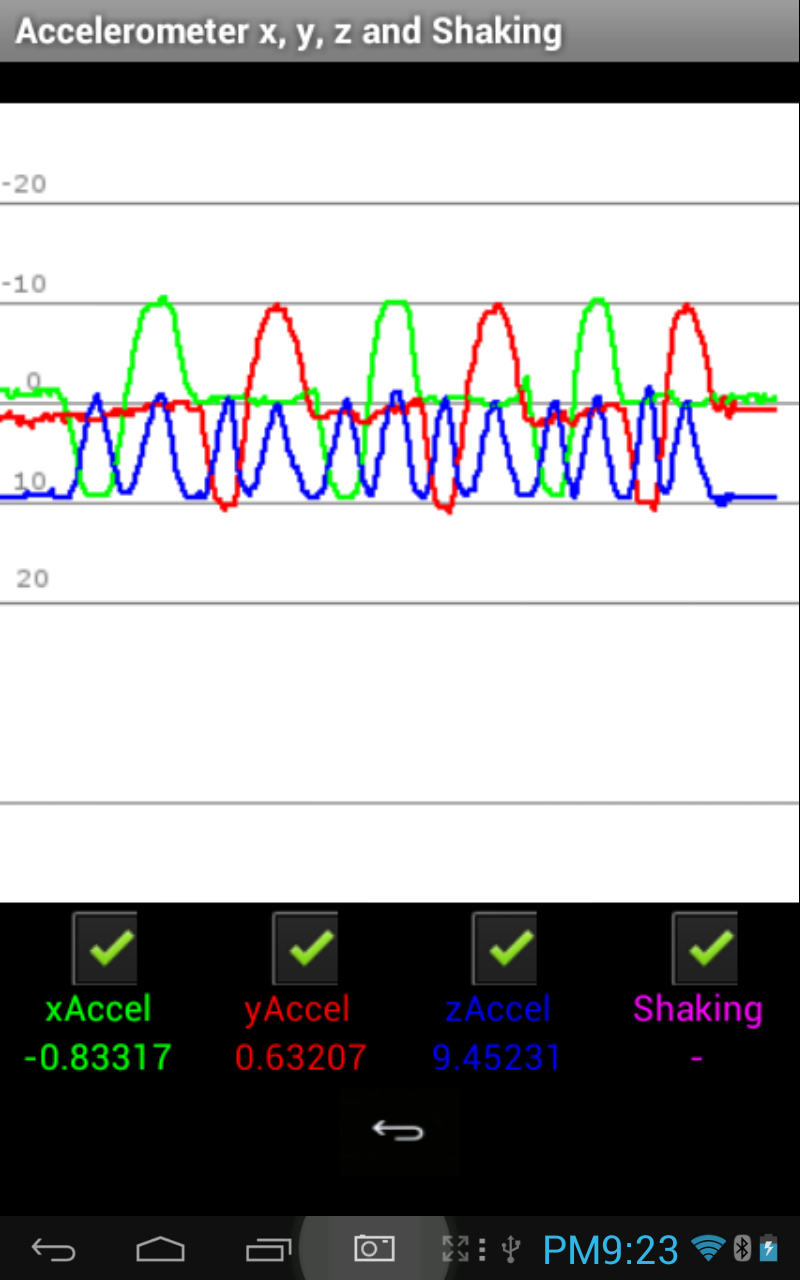
This screen shot of the actual app shows how each axis is affected by gravity starting with the device face up on a tabletop then...
- rotating to the left until the left side is touching the table then rotating back to face-up (green trough)
- rotating right until the right side is touching the table top then back to face-up (green mound)
- rotating forward until the bottom of the device is touching the table top then back to face-up (red trough)
- rotating backward until the top of the device is touching the table then back to face-up (red mound)
This is repeated three times as shown in the graph.
Note that when rotating about the YAccel-axis, YAccel is near 0.
And when rotating about the XAccel-axis, XAccel is near 0.
ZAccel oscillates from 9.8 when the device is face-up to 0 when it is facing left, right, forward, or backward resulting in a force of 0.
You can test this project on the emulator if you don't have a device to see an approximation of what the output might look like.
Pressing Ctrl+F11 toggles portrait and landscape orientations which triggers the XAccl and YAccel values to change.
ZAccel always remains at about 4.9, however.
A handy utility!
I had suspected my X sensor was noisy. This confirms it.
The Shaking label never turns off once it has been triggered?
A timer clears the value after two seconds.
--
I had suspected my X sensor was noisy
I suppose you already know this, but you can take several samples from a sensor property then average them to smooth out a sensor result.
I did not do that in this example.
I did average OrientationSensor Azimuth values in my basic digital compass project to keep the dial that indicates current heading from swinging too wildly.
--
Thanks for the tip.
I had some idle speculation of using the waveform of the Orientation Sensor to detect small table vibration patterns during battery bounce tests. (There's a YouTube video going around ostensibly showing how weak AA batteries rattle when they bounce off their negative ends while fresh batteries bounce with a thud. (search for 'battery bounce test snopes' for discussion.)
This is all just for fun.
--
Interesting. I had not realized the accelerometer could indicate levels of vibration.
--
Have you developed a method for the graphs to slide to the left as time passes. Ie new data comes in from the right and slides across the screen, disappearing out the left side?
--
You might have to use multiple images connected
to your canvas like tank treads, using the Save Canvas
block to prime the images with saved canvas files
when the current canvas fills.
Shrink the leftmost image width as the canvas on the right fills.
When the canvas fills, save its image and propagate the list
of image files down your list of image components, using the
ANY Image blocks, then clear the canvas and resume drawing.
--
When the Canvas is filled from left to right with the initial graph, a snapshot of the canvas might be taken then inserted in an ImageSprite which could then be scrolled to the left one pixel per Clock Interval.
Now you have to plot new points trailing behind that ImageSprite and redraw them each time the ImageSprite moves a pixel to the left, then capture the screen again when they have reached the left edge of the Canvas.
That would require too much processing, I think.
--
I wonder if it would be possible to save the results during a measurement for subsequent analysis results, in the Excel or some other program.
And if it is possible, who can i do it?
And if it is possible, who can i do it?
--
You might ask that question on the MIT App Inventor forum.
--
Thanks for the tip
--
It's awesome.
--
댓글 없음:
댓글 쓰기