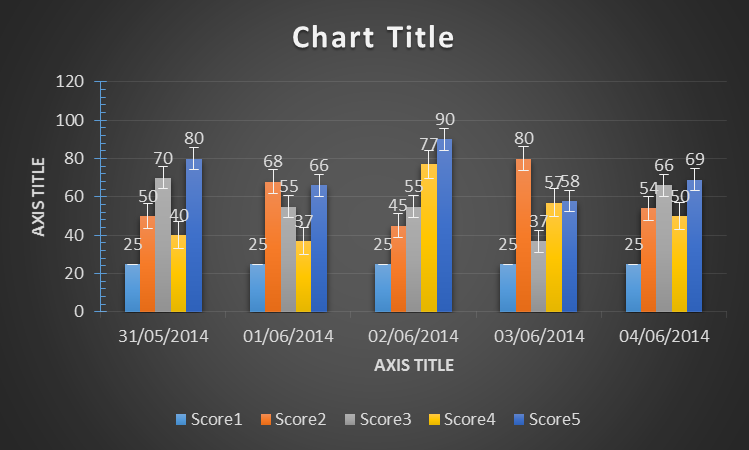
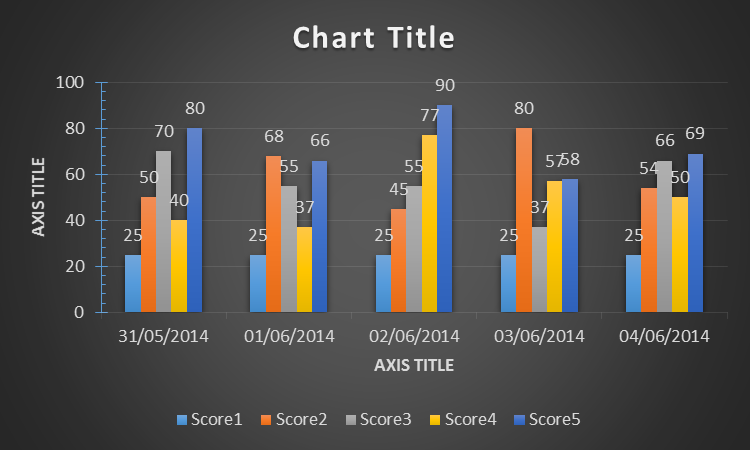
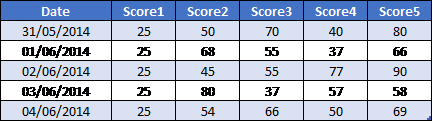
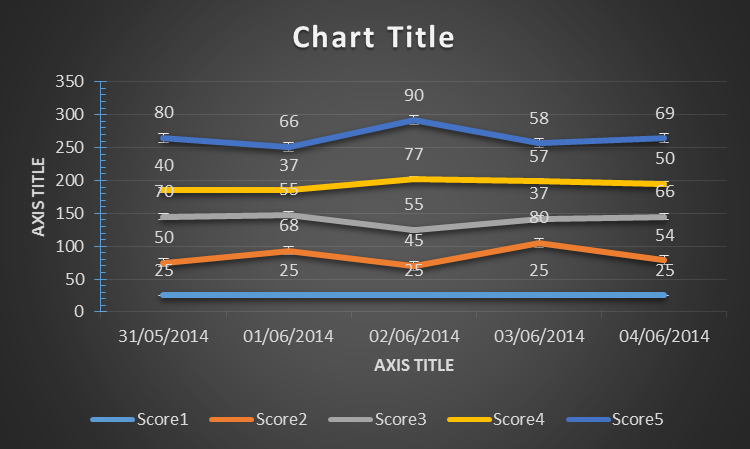
Please advice how to plot a Chart (Line, Bar, with option to add Candle Stick - Error Bar) for data saved in the file (saved using File Component of App Inventor). I need to plot a chart for Five Variables for given date Range. Following is the sample data.
File Data: (2 Jun 2014 13:11:06 46 53 100 35 75)
Please see attached Pictures for Sample Data and Charts (created in MS Excel)
--
the (unfortunately) deprecated Google Chart API https://google-developers.appspot.com/chart/infographics/docs/overview is easy to work with
you will be able to use it until April 20, 2015
for an example how to use it see here http://puravidaapps.com/qr.php#q
alternatively search for another API here http://programmableweb.com/
--
댓글 없음:
댓글 쓰기