Use of MIT App Inventor has increased tremendously this fall. Our current weekly active usage is 11,000 on App Inventor Classic and 92,000 on App Inventor 2. That’s for MIT App Inventor alone: We don’t know how many users there are on other App Inventor servers.
MIT App Inventor 2 appeared about a year ago, in December 2013. Since then, our MIT server has hosted 980 thousand users who among them have created 2.6 million saved projects. App Inventor Classic, which has been around since January 2012, has hosted 1.6 million users with 3.8 million projects. Accumulated numbers are impressive, but the weekly active numbers give a more useful picture of what’s happening.
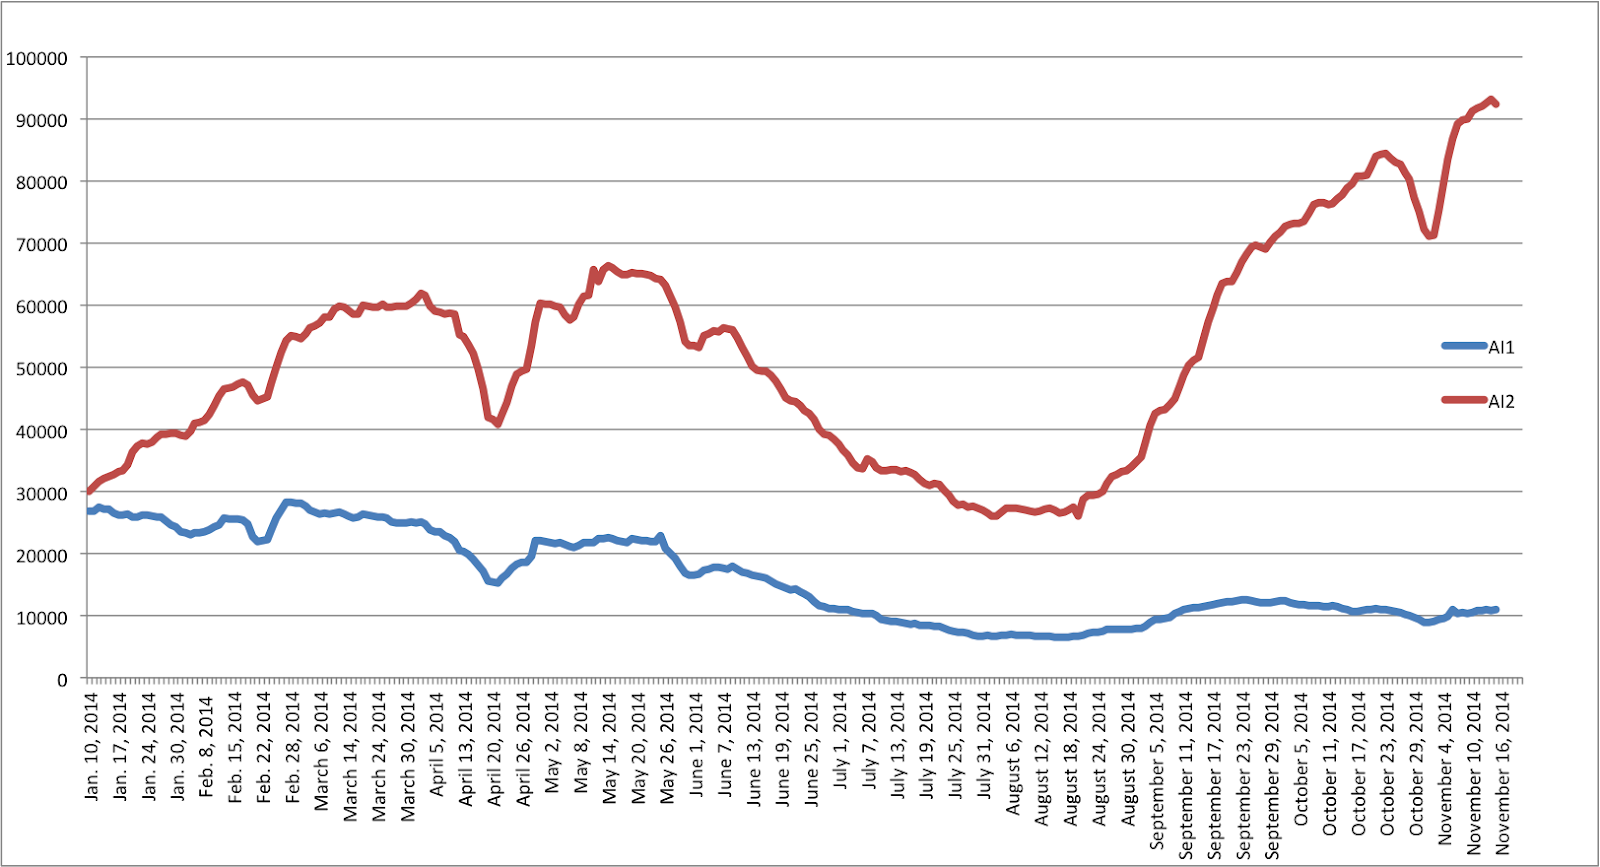
Here’s a graph showing the numbers of weekly active users for Classic and AI2 since last January.
Here are some things that stand out:
- AI Classic usage is declining, as we intend it to. But there are still 10,000 Classic users weekly.
- Both Classic and AI2 had significant usage declines over the summer, followed by increases in the fall. That suggests there is a lot use in schools, a suggestion that’s supported by a similar dip last April, perhaps coinciding with spring school break.
- There was a two-day dip in AI2 at the end of October: The daily numbers were 21,000 on October 31, 13,000 on Nov. 1, 8000 on November 2, and back to 20,000 on November 3. Does anyone have an explanation?
- AI2 use exploded at the end of the summer, going from under 30,000 the week of August 24 to 70,000 by the end of September, and still seems to be climbing.
The break at the end of october could be connected to Halloween.
Don't know about other countries, but nov 1st is public holiday in germany.
댓글 없음:
댓글 쓰기